
Want to predict whether the majority party is going to change soon in the House or Senate? Or find out which exchange rates are driving others up or down? How about coming up with an easier way to rank Division I football teams this season?
Peter Mucha isn’t an expert on any of these questions, but he can help out with all of them — you can get to all three answers using the same kind of math, he says. Legislators, exchange rates, and sports teams make up networks: Harry Reid is a node in a network of senators connected to each other by how they vote, the dollar’s strength against the yen moves up and down as other currencies gain and lose value, and the Tar Heels move around in a network of teams as they win or lose. In a sense, it doesn’t matter what you’re talking about: if you have nodes and some kind of data to make connections between them, you have a network.
Mathematicians have always been interested in networks, Mucha says, but computers have allowed them to start working with much more complicated systems. When a network has just a few nodes connected by a few pieces of data, it’s pretty easy to see how they’re all connected to each other. As the number of nodes increases, things quickly get more complicated. Mucha looks for mathematical strategies to make these large data sets useful to nonmath researchers in science and social science fields.
The internet has also driven interest in network science, both because it creates new networks to study (Facebook, for example) and because it gives researchers easy access to a lot of interesting but more traditional data sets. When Mucha and a postdoc colleague decided to study networks, they looked at assignments of representatives to House committees and subcommittees. Getting started was as easy as pulling the data from Congress’s website.

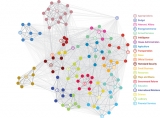
The idea behind that first project was to figure out the math that would help them quantify relationships between nodes in a network, dividing them into groups of higher connectedness. “If I tried to draw a picture of every one of the nodes in the network,” Mucha says, “that would be 435 representatives, plus delegates, plus midterm replacements and so on, connected by their memberships in 115 committees and subcommittees. It’s a mess; you can’t make any sense of that picture. What the algorithm does is group the dots.”
The connections between nodes in a network aren’t all the same — they can carry different weights. In this case, some representatives might have one committee or subcommittee assignment in common, while others might have two or three. The community detection math uses these weighted connections to cluster nodes and describe exactly how closely they’re connected to each other and to other groups of nodes. The strength of this clustering result is called modularity.
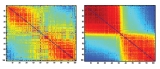
Mucha used roll-call voting data in Congress to define how modular (or not) congressional voting has been throughout U.S. history. This puts a number on a phenomenon most people just sense in a general way: there are years when senators and representatives vote in fairly stable blocks, usually along party lines, and years when they vote less predictably.
The researchers found that modularity in Congress has gone up and down many times: it was high in 2004, the year George W. Bush was reelected, but it was just as high at the end of the eighteenth century, not long after George Washington gave his farewell address cautioning Congress not to become too partisan.
They also found that when Congress is medium in modularity — a state somewhere between the very polarized voting in the Senate today and the lower polarization of forty or fifty years ago — there’s a higher chance that the majority party will change. When voting modularity in Congress is low, the researchers say, party membership doesn’t mean as much and there’s less drive for one party to try to gain control. When modularity’s high, it’s hard for the minority party to overcome the majority’s cohesion.
In congressional networks, the nodes are connected by simple information: counts of committee memberships or common votes. But there are lots of other ways to link nodes in a network. For example, two nodes that correlate 70 percent with each other can be clustered more tightly than nodes that correlate 50 percent. That’s how Mucha and economics colleagues organized networks of currency exchange rates. When two exchange rates correlate closely with each other, they show up in a cluster.
Before the Asian currency crisis of 1997, the Australian dollar dominated a large cluster of exchange rates. But after the crisis began, the Australian cluster broke up and a new cluster of rates emerged based on the value of the British pound. This is the kind of result that isn’t visible in a data set until you build the network — economists wouldn’t have guessed that the Thai bhat, the currency that began the crisis when its value suddenly dropped, had so much influence on the value of a major European currency.
Right now, Mucha is in the early stages of collaborating with other UNC faculty in areas from population demographics to materials science to international studies. But in his spare time, he plays around with network analysis in less academic ways. Mucha wasn’t impressed with the Bowl Championship Series (BCS), the mysterious matching system that decides which top Division I football teams will play each other. “We’ve all experienced befuddlement upon perusing the BCS standings, because of the seemingly divine inspiration that must have been incorporated into the determination,” he wrote to other college football fans on his blog, Random Walker Rankings.

So he decided to come up with a simpler ranking system using an algorithm that randomly “walks” around the network. On each walk, it acts like a football fan with no loyalty strolling through the network, changing allegiances based on teams’ records of wins and losses. Collectively, the walking fans make up a ranking of the teams. The system guarantees that strong teams will play other strong teams, and it’s easier to understand than the BCS method. Each season, Mucha blogs about the system’s rankings, and he’s published about the system twice in math journals. He’s no football expert, he says — it’s just another way to play with the mathematical concepts he works with every day.
“There are focused people in the world whose life’s mission is to study X,” he says. “My path has been more that I’ve met people who have introduced me to some interesting problems. I’m a tools guy.”
Peter Mucha is chair of the Department of Mathematics in the Colleges of Arts and Sciences, and an associate professor in Carolina’s Institute for Advanced Materials, Nanoscience, and Technology. Much of his network analysis research was done in collaboration with Mason Porter, now a lecturer at Oxford University. James Fowler, a professor of political science at the University of California, San Diego, coauthored the study of polarization in Congress.