

The end of the earth” is what Scott Madry calls the area of Africa where the countries of Zaire, Rwanda, and Uganda merge and form the Virunga Mountains. “It’s so remote, you have to pay people to carry car batteries up there just for power,” he says.
Madry, research associate professor of anthropology, first became acquainted with the Virunga Mountains back in 1993, when he was associate director of the Remote Sensing Center at Rutgers University. Dieter Steklis, a colleague in the anthropology department and a renowned primatologist working under the auspices of the Dian Fossey Gorilla Fund, needed help charting information on the fewer than 600 gorillas left in the area. For instance, he wanted to make a map of the different types of vegetation so that researchers could plot how the gorillas move and what they eat.
Steklis came to Madry not because he knows about gorillas, but because he knows about maps. Sophisticated maps. In fact, Madry, who studied spatial — or landscape — archeology as a graduate student at Carolina in the 1970s, was one of the first handful of scientists to apply geographical information systems (GIS) to archeology.
As a student, Madry says he was interested in archeology but not all that interested in “digging around in a single site for years.” He was more into the patterns of ancient settlements or roads, for instance, and showing how cultures interact with the environment over time. For his master’s thesis, he analyzed aerial photographs of France, looking for vestiges of cultural remains — old roadways, foundations of structures — and then plotted them on maps he taped together to see if he could find patterns such as how the layout of roads changed between Celtic and Roman times. As a pilot, he also enjoyed flying around and looking for archeological sites. “Applying GIS to archeology was a perfect fit for me,” Madry says.
The idea behind GIS is to take data from many different sources — historic maps, satellite images, aerial photos, field research data — and put it all together so that each set of data aligns with the others — like layers in a cake. “If you were to stick a pin down through it, you’d be in the same place on each layer,” Madry says. After all of the data are entered into the system, researchers can look at layers individually or pick two or three to look at together. They can then see the patterns in the data and look for new locations with similar patterns.
For most GIS projects, Madry usually starts with at least some good satellite images and navigable maps. But if you’ve ever seen the film Gorillas in the Mist about Dian Fossey’s efforts to save the mountain gorillas, then you know that the area is constantly shrouded in clouds, making it difficult to get aerial and satellite views of the land.
Compounding the problem is that while the area is one habitat to the gorillas, politically it’s three different countries, each with its own set of natural and man-made strifes. The Rwandan genocides of 1994, for example, caused people to flee the country and set up refugee camps in the Virunga Mountains. Needing food, many refugees set traps. While the people aren’t necessarily after the gorillas, Madry says many gorillas end up getting caught in the traps because a snare can’t tell the difference between a gorilla and a gazelle.
Existing maps weren’t much help. The best Rwandan maps were colonial Belgian maps from the 1930s that Madry found at the national archives in Brussels. Uganda’s most reliable maps were 1950s British maps left over from when Uganda was still a British colony. “But when you put the two together nothing matched up,” Madry says. “Not to mention that all of the maps and photographs of Zaire are military secrets and nobody can have access to them.”
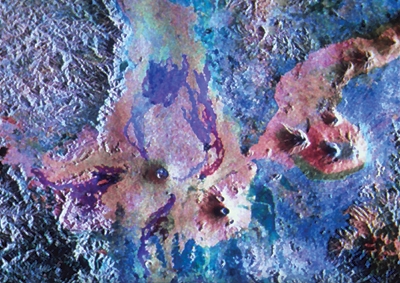
So with friends in high places — Madry had worked at a NASA research center — he became a guest investigator on a 1994 space shuttle mission that included a satellite imaging radar system known as the Shuttle Imaging Radar, or SIR-C, which burns right through the clouds and captures overview images of a particular area.
Madry took part in two shuttle missions that year — in April and September. Coincidentally, the first was before the genocides began, and the second was after “all hell broke loose in Rwanda,” he says. While Madry’s team was gathering these images for basic research, the United Nations (UN) was also looking for maps of the area to deal with the influx of refugees — over 750,000 — that fled to the area surrounding the gorilla park.
The UN caught wind of the project and the next thing you know, “all these guys from the Red Cross and other relief organizations were driving around the area getting from one refugee camp to the other using our maps and satellite images,” Madry says.
To create much of the information for the GIS maps, Madry and the primatologists trained native wardens and trackers to use global positioning system (GPS) receivers so that when they were out in the field, for example, and saw a gorilla eating vegetation or a poacher setting a trap, they could enter the exact location and time. While initially designed for and controlled by the U.S. military, GPS is a navigating system that uses a series of 24 satellites as reference points to calculate precisely where on the planet you happen to be. In a nutshell, the receivers work by measuring our distance (determined by how long it takes for a radio signal to reach us) from three of the satellites. Positions accurate to within three meters (about 10 feet) are common.
“GPS has made a huge impact on our work,” Madry says. “When we find something in the field, we can click a few buttons and then enter our location and any data we record into the GIS, and we can display it the same day. On the other hand, we can also download locations from the GIS model we’ve created into the GPS units and use the receivers to actually navigate us to that place in real time.”
But there were many obstacles, including no benchmarks — in other words, no known coordinates. “Every time we tried to put a brass surveying monument in the ground, for example, someone would steal it because it’s brass and you can sell it and feed your family for a day,” Madry says. “So ultimately, we literally just drove a bunch of big iron rods into the ground outside what was Dian Fossey’s camp [and is now the main research camp], said this is zero, and built out from there.”
Now that the groundwork has been laid, Madry says the exciting thing about GIS is that it’s cumulative. “As each set of researchers acquire data and enter it into the system, it allows the next set of people to have access to where those people were and what they did. It helps the primatologists do a better job of what they do, not only the anti-poaching and security and the basic science but the politics and the fundraising,” Madry says.
Not to mention the media attention. Since Madry’s maps are the only coherent existing maps of the area, the National Geographic Society (NGS) decided to use them as part of its newly renovated Explorer’s Hall Permanent Exhibit, which was unveiled in December 2001. Based on Madry’s maps, NGS had a huge 3-D solid terrain model of the area created to go along with 15 other models, showing Earth as viewed from satellites. The models are actually located on the outside of Explorer’s Hall so that anybody who walks by can see them and learn about the Virunga Mountains and the Dian Fossey Fund’s efforts to save the remaining gorillas that inhabit the area.
Madry has also been in the news lately for a project a little closer to home. Teaming up with the North Carolina Department of Transportation (DOT) and Environmental Services Inc., Madry is in charge of a GIS project that will eventually help save the DOT time and money.
Starting with the piedmont area, Madry’s team will computerize all of the known 37,000 archeological sites in North Carolina. Then the team will develop predictive models for the probable location of undiscovered sites.
“Not a lot of people do archeological modeling because it is so complex and arcane,” Madry says. “But this is what I really know how to do, so this project is a great match for me.”
The idea is that before starting a road project, engineers will consult the GIS so as to avoid planning roads through areas that might contain undiscovered ruins or villages. “It’s much better to avoid these things in the first place,” Madry says. Although the DOT conducts surveys and goes through a maze of federal and state environmental reviews, there are still times when they hit a significant archeological site after they start building a highway. And at that point, they can incur months, if not more, of delays because archeologists have to go meticulously through the site and report everything, adding up to millions of dollars lost.
The team will also scan all 971 existing topographic maps into the system and correlate them with the archeological sites. In addition, they will build in an environmental GIS that shows information such as location of streams, soil types, elevation, topography, slope, and faults.
All of this information will then be combined so that when, for example, a bypass will be built around a city, engineers, planners, designers, archeologists, and wildlife biologists can all sit in front of their computers and see which nearby areas are of high archeological sensitivity. Armed with that information, the DOT can then lay out a proposed corridor for the bypass and present it to the community.
“GIS is a wonderful tool for explaining to the public as well as to decision makers why we are doing what we’re doing,” Madry says.
Catherine House was formerly a staff contributor for Endeavors.